Research, design and deployment of a CO2 monitoring system across 40 classrooms at Instituto Velázquez during the pandemic: scientific motivation, prototyping, results, a usage guide and DIY-replica firmware.
Based on Harvard University and CSIC guidelines, a room is considered well-ventilated between 800-950 ppm CO2 (outdoor air is around 400-420 ppm); above 1000 ppm ventilation is insufficient. Recommended air changes per hour (ACH) for a 100m² classroom with 25 students aged 5-8 is 5-6 ACH.
CO2 itself isn't the pathogen, but works as an indirect indicator: at 800 ppm, roughly 1% of the air breathed has already been exhaled by someone else. Studies from the University of Seville confirm Mediterranean naturally-ventilated classrooms typically exceed WHO-recommended maximums.
Infections forced students and staff into isolation, creating inequality between those attending in person and those following classes from home. With ratios of up to 30 students per classroom, CO2 could reach critical levels.
It was also framed as an educational opportunity: senior students could assess ventilation as a STEM project.
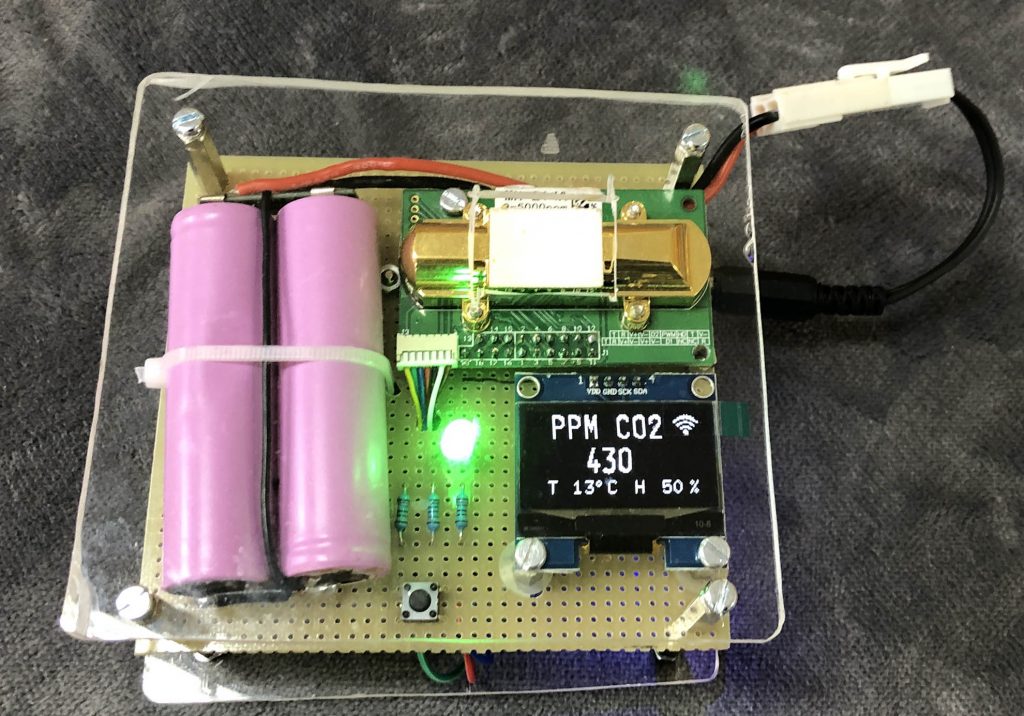
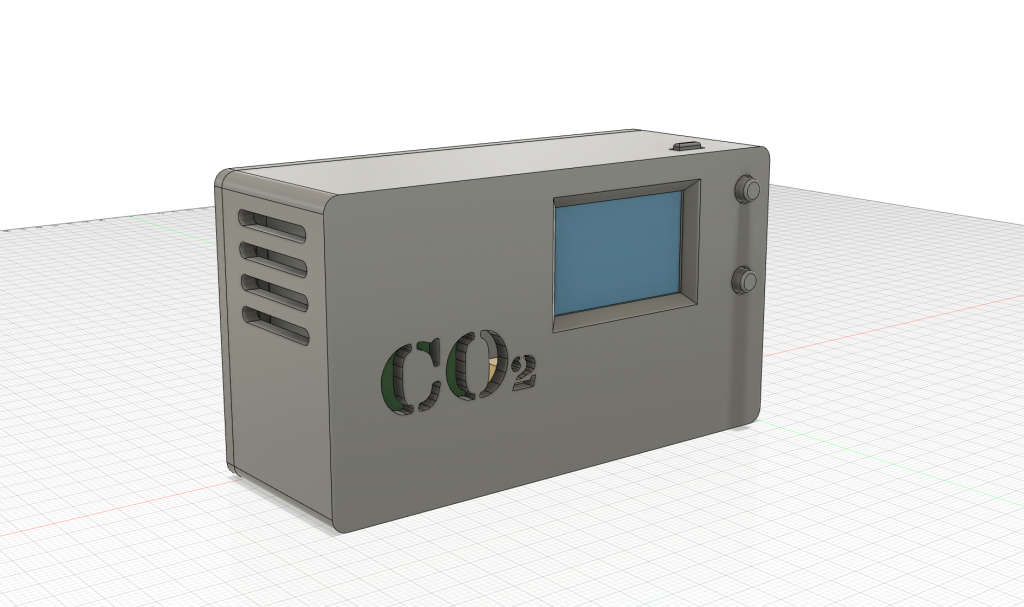
Several prototypes were built using NDIR (non-dispersive infrared) sensors: MH-Z19 and MH-Z14 on Arduino, and a third using the Sensirion SCD30 sensor (more accurate, ±30 ppm) on a TTGO ESP32 + color OLED board. A case was designed via CAD and 3D printed.
The classroom placement was chosen away from windows/doors and air currents, over 2m from occupants, at seated student height.
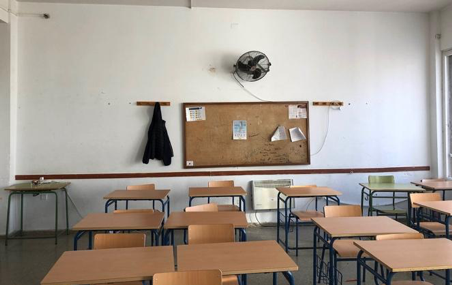
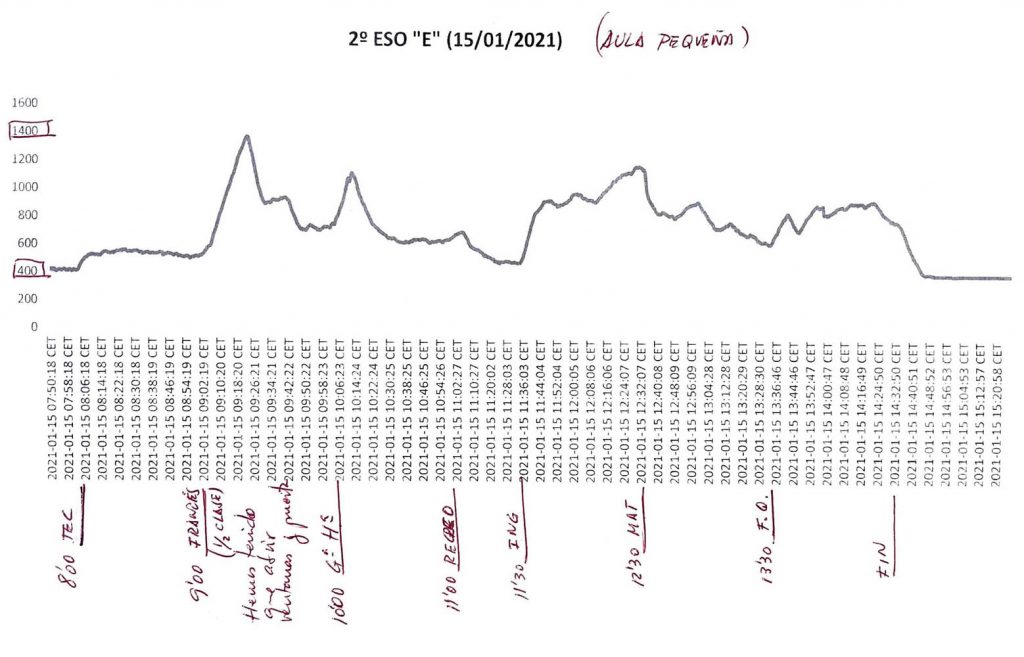
Beyond automatic ThingSpeak logging, each class's delegate manually recorded CO2 concentration, student count, and door/window status every hour. Analysis of a typical classroom (30 students, 6.65×6.80×3.40m) showed CO2 rising from 400 to over 1370 ppm when doors and windows closed, dropping back to 400 ppm during breaks.
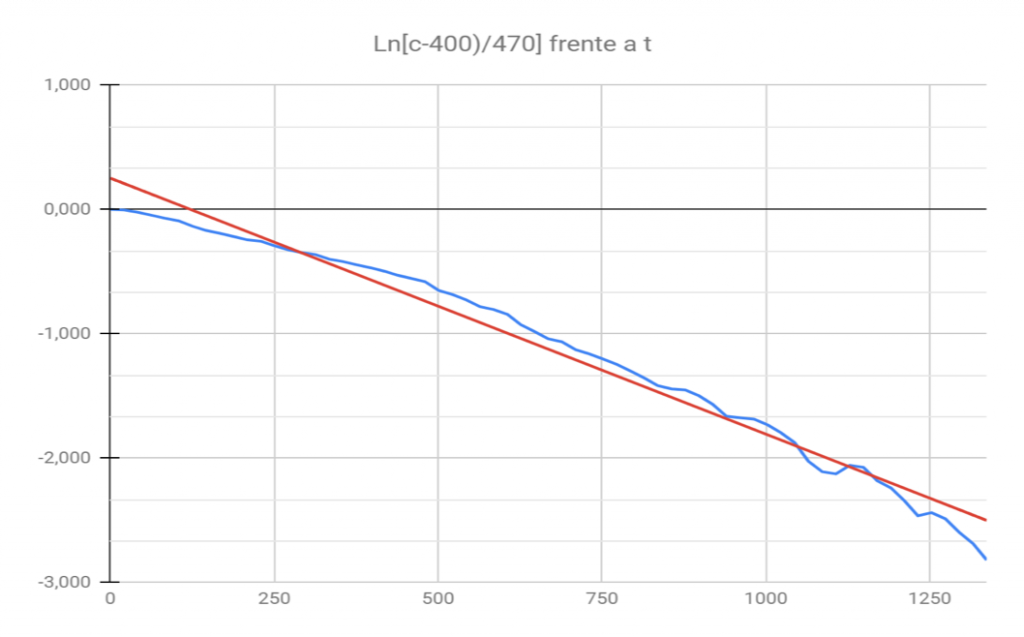
The air changes per hour (ACH) rate was experimentally validated via linear regression on the CO2 decay curve, yielding 7.41 changes/hour versus 7.59 from the theoretical guide.
The goal: improve academic performance, reduce infection risk and increase thermal comfort, through a sensor network mapping the school's CO2 in real time (classrooms, hallways, library, staff room).
Acknowledged limitations: CO2 doesn't degrade the same way as an airborne virus, particle emission from talking/shouting/singing isn't proportional to CO2 output, and per-person CO2 emission varies with age, sex, weight and metabolic activity — CO2 is a useful proxy, not a direct measure of infection risk.
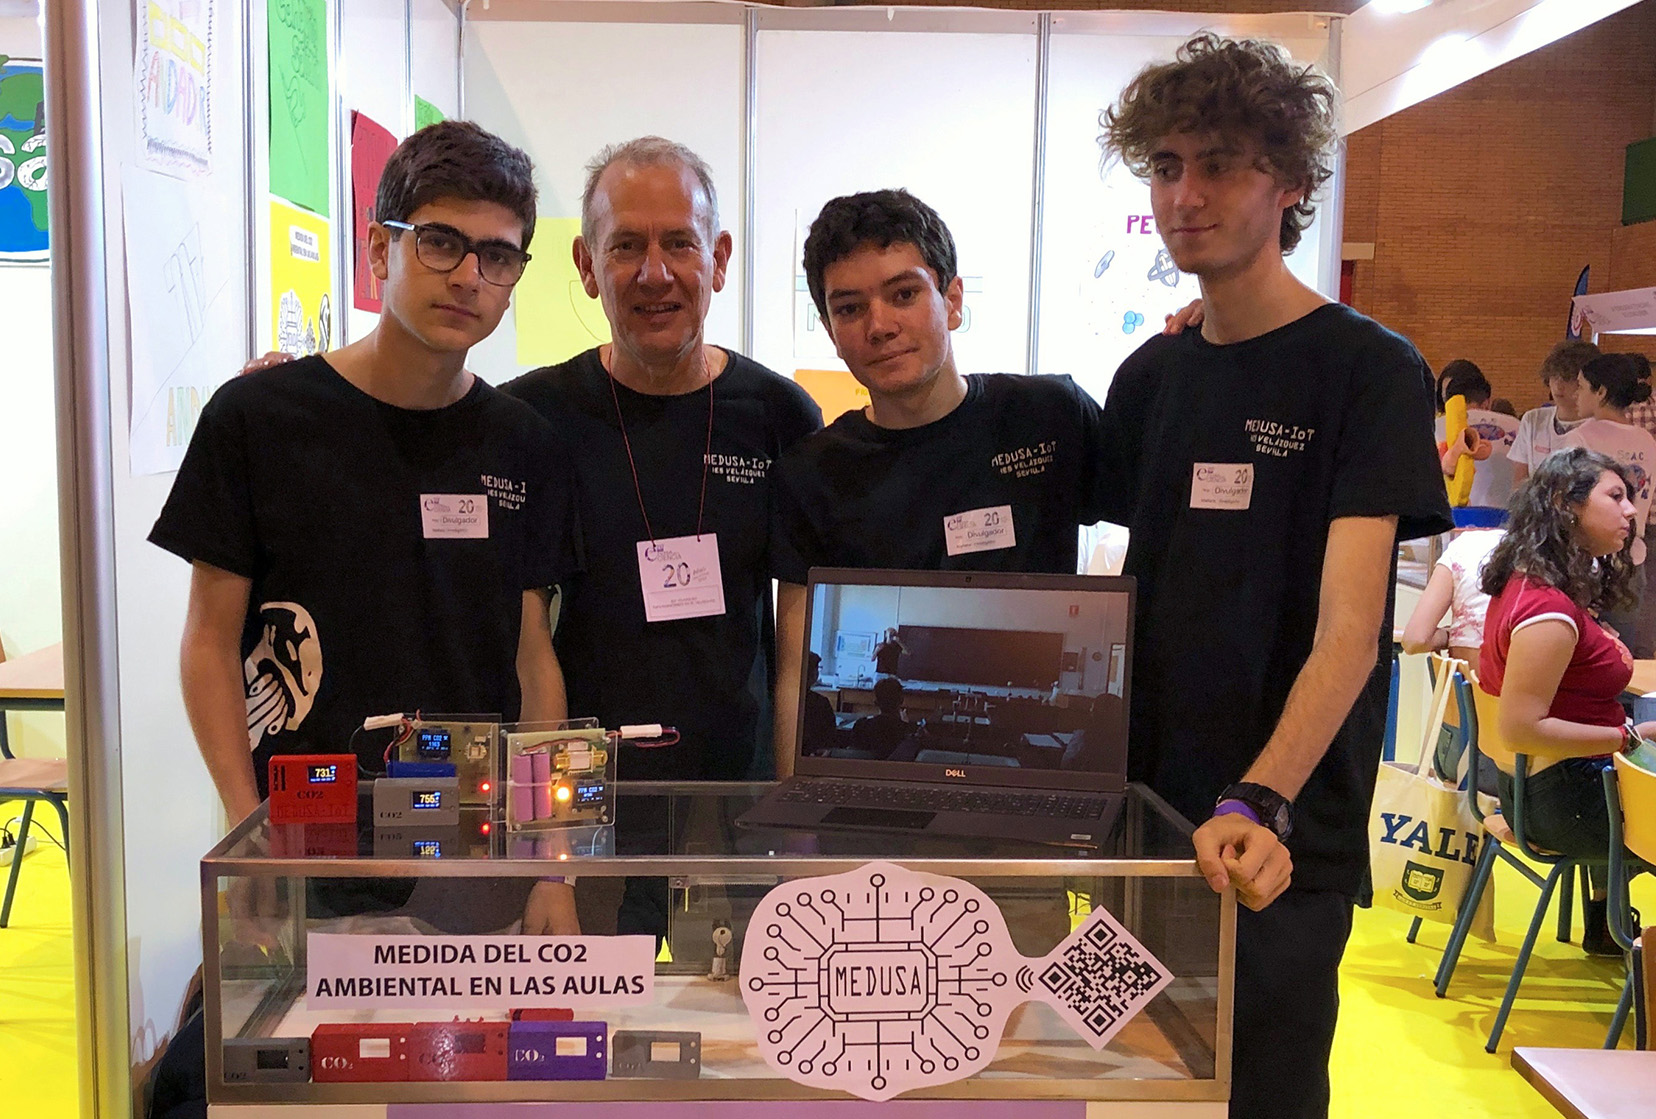
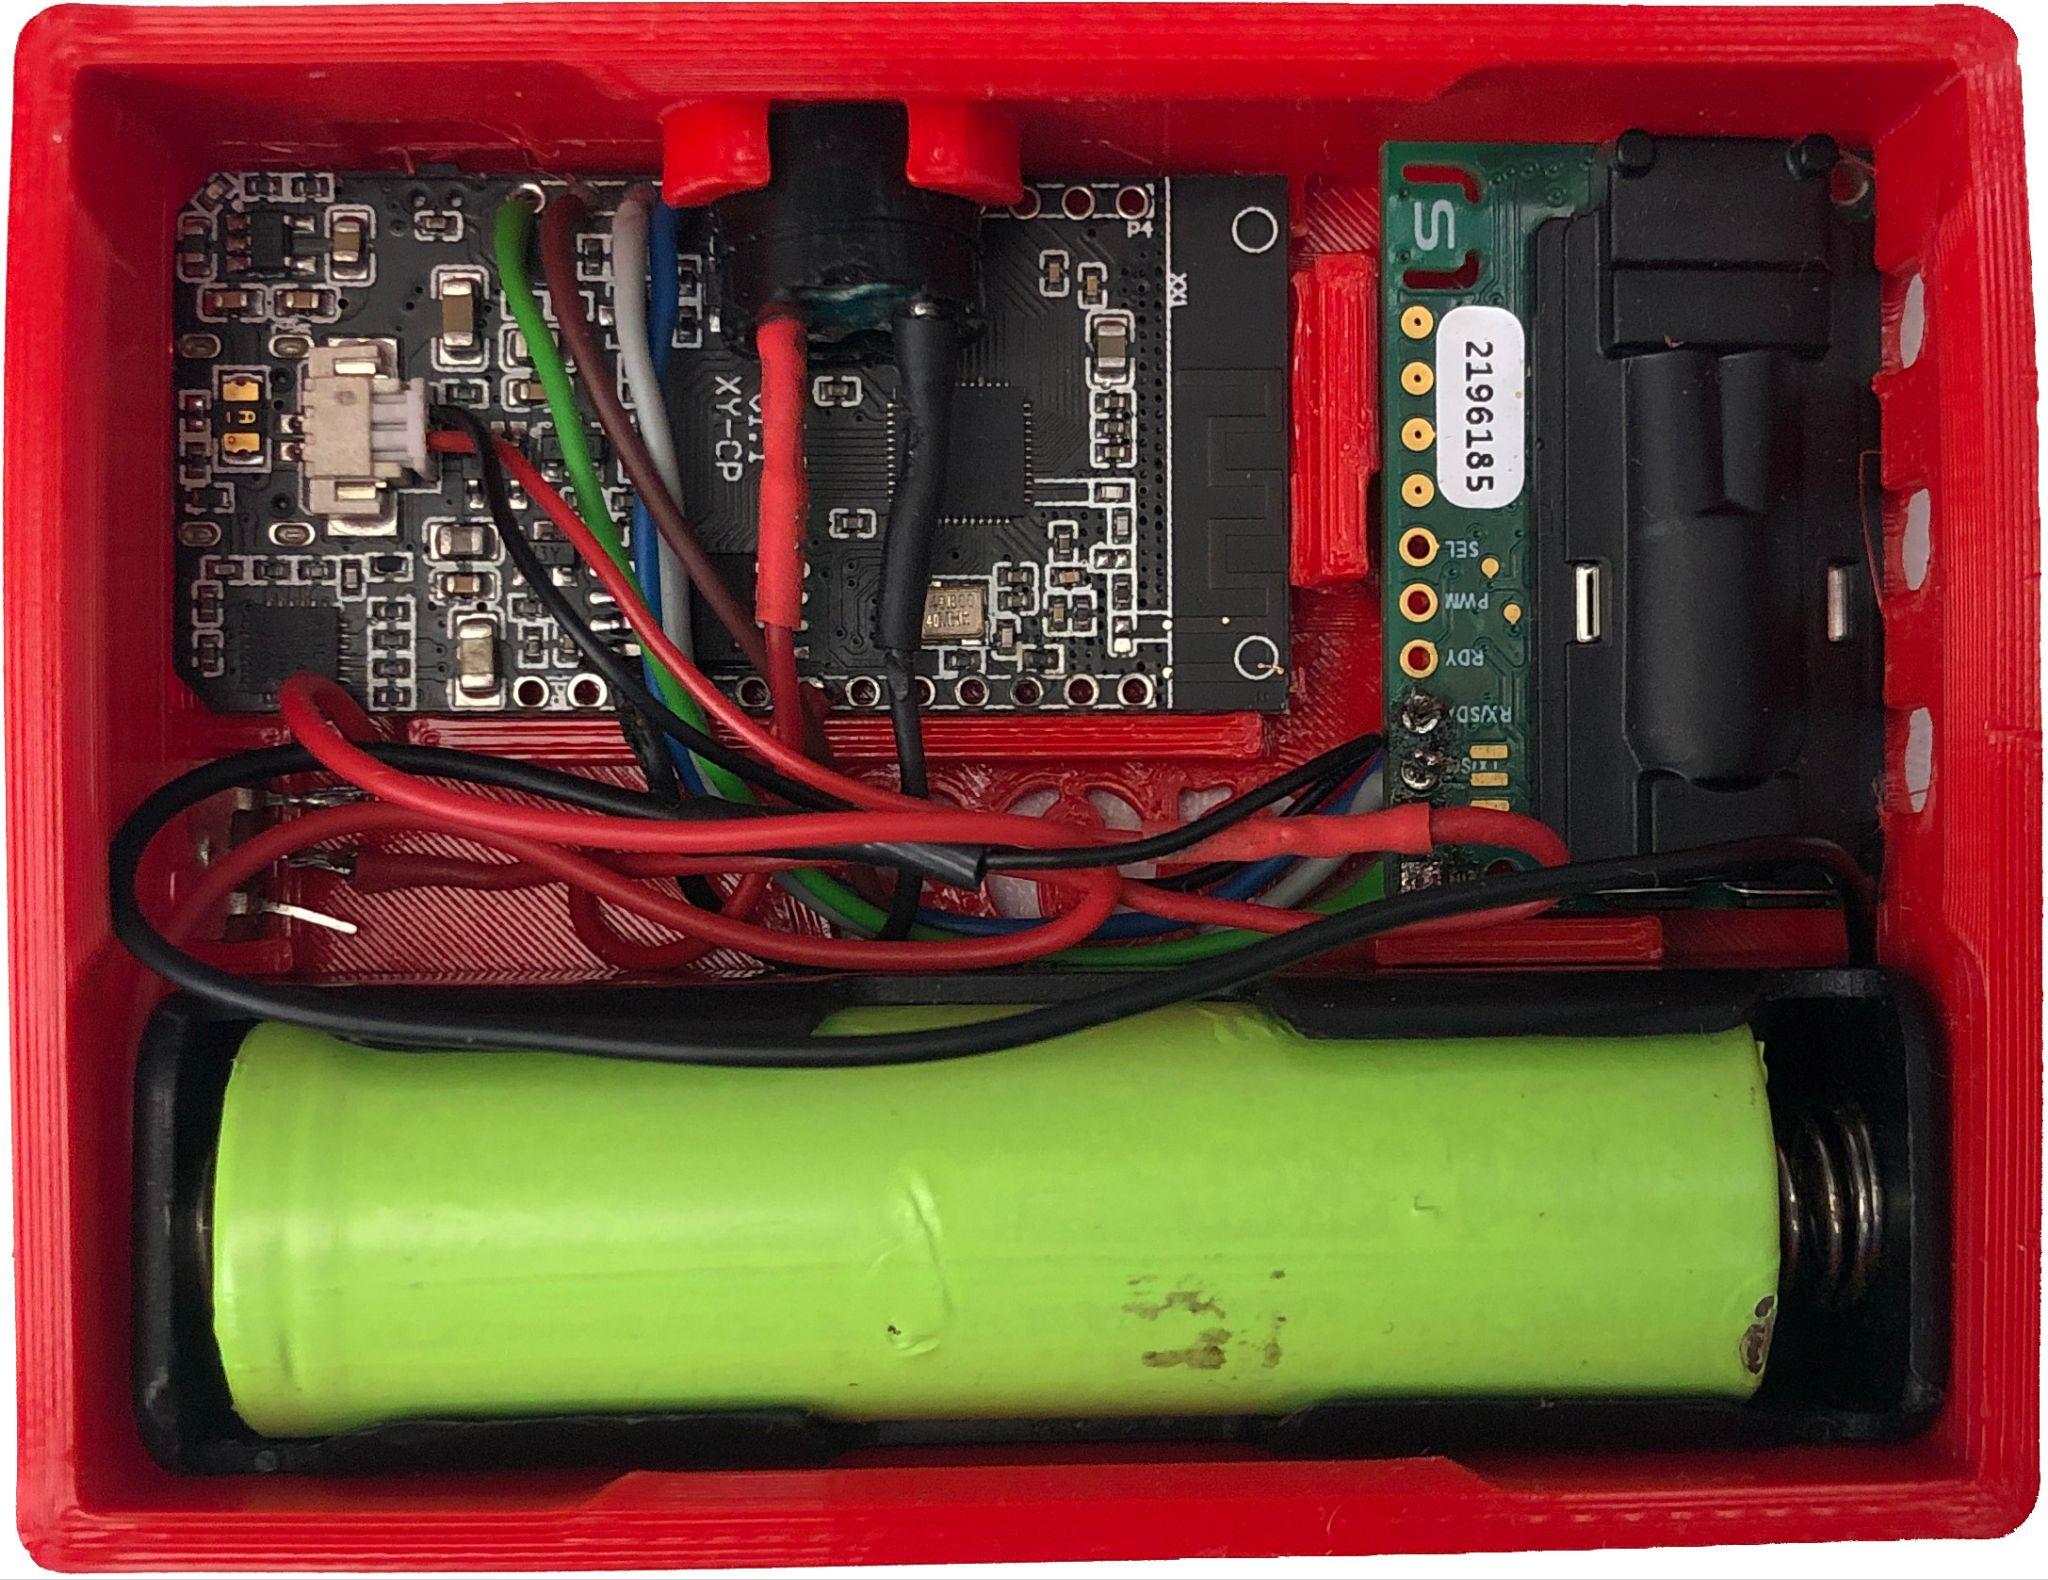
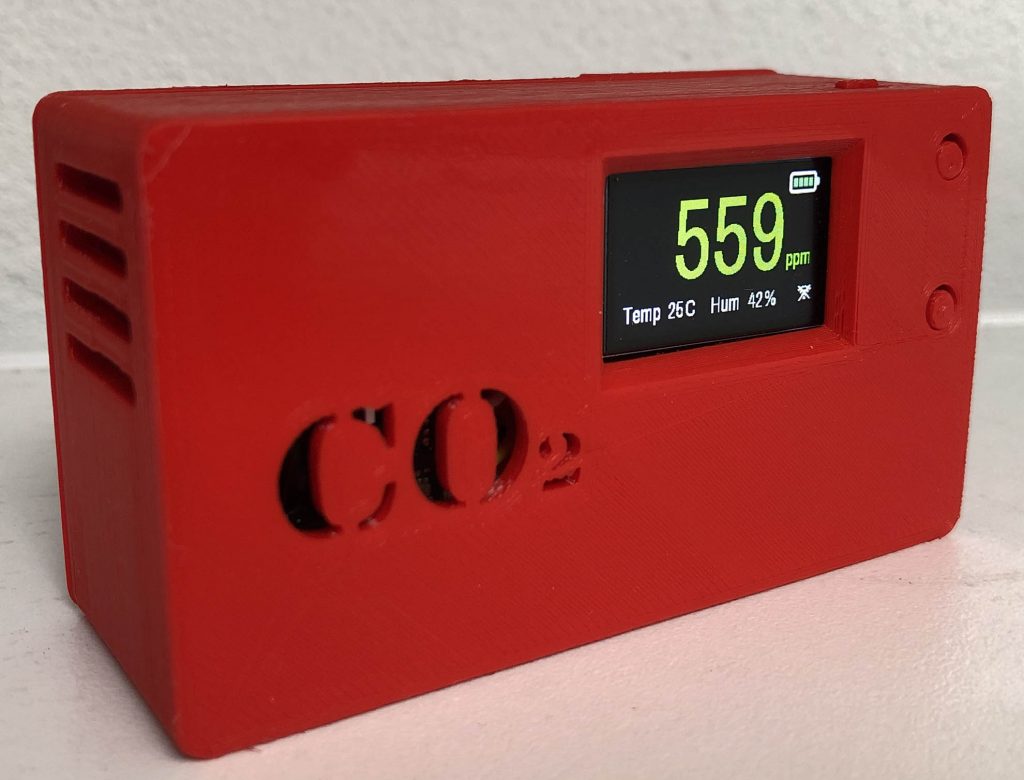
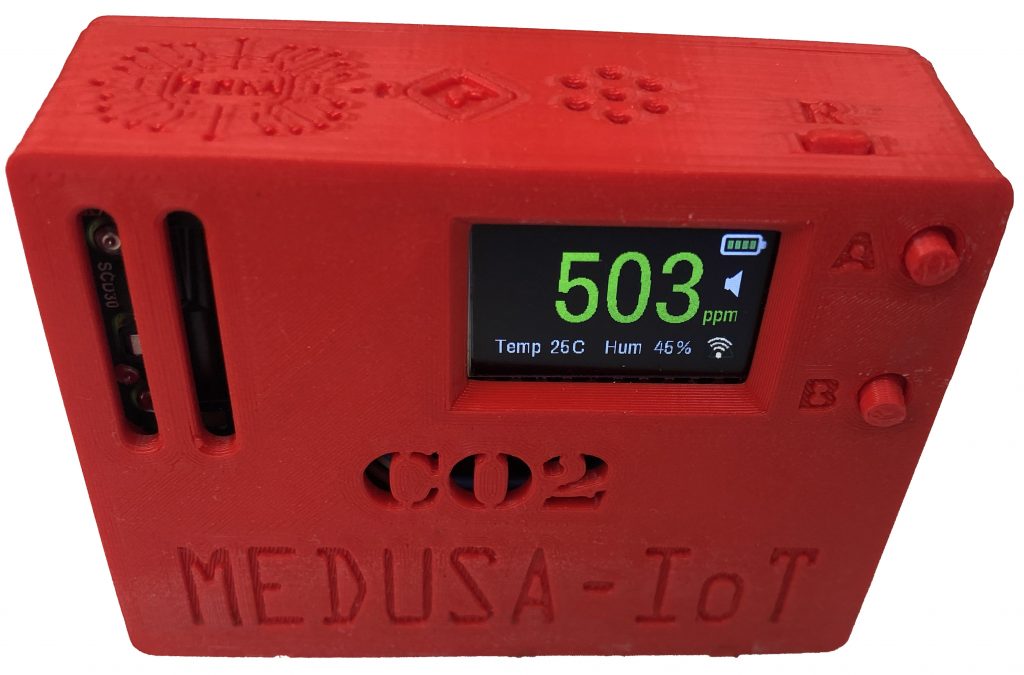
Two final models: Medusa_CO2 (Sensirion SCD30 sensor, LILYGO TTGO T-Display ESP32 board, 1.14" color display, USB-C, 40×83×21mm, 40g) and Medusa_CO2_battery (same base with a rechargeable 18650 Li-ion 3000mAh battery via USB-C, 40×83×40mm, 93g).
Case designed and 3D printed screw-free for easy assembly.
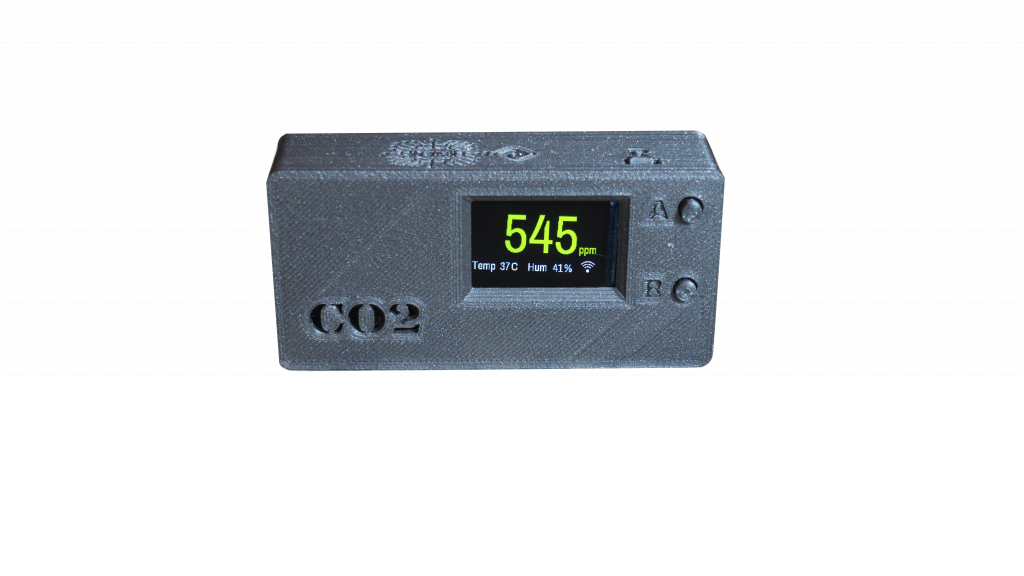
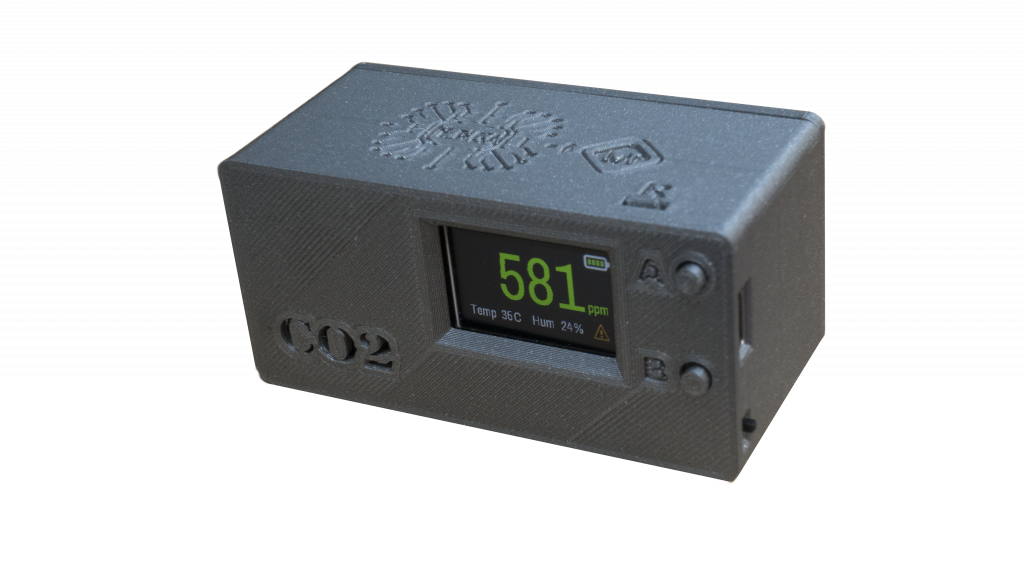
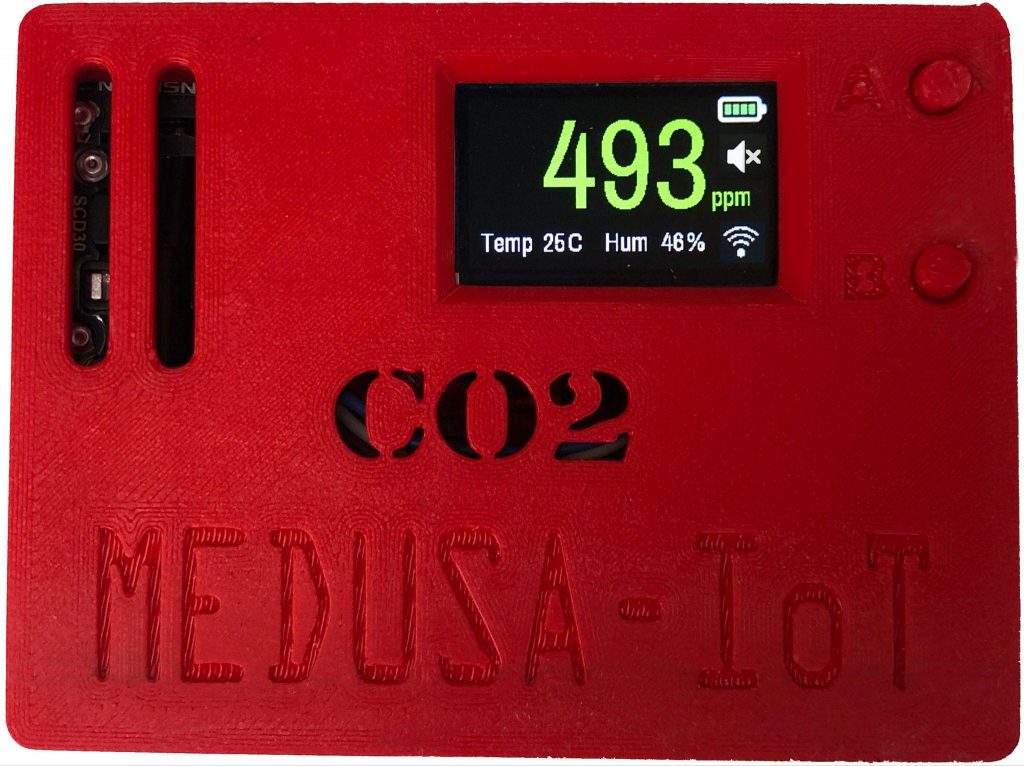
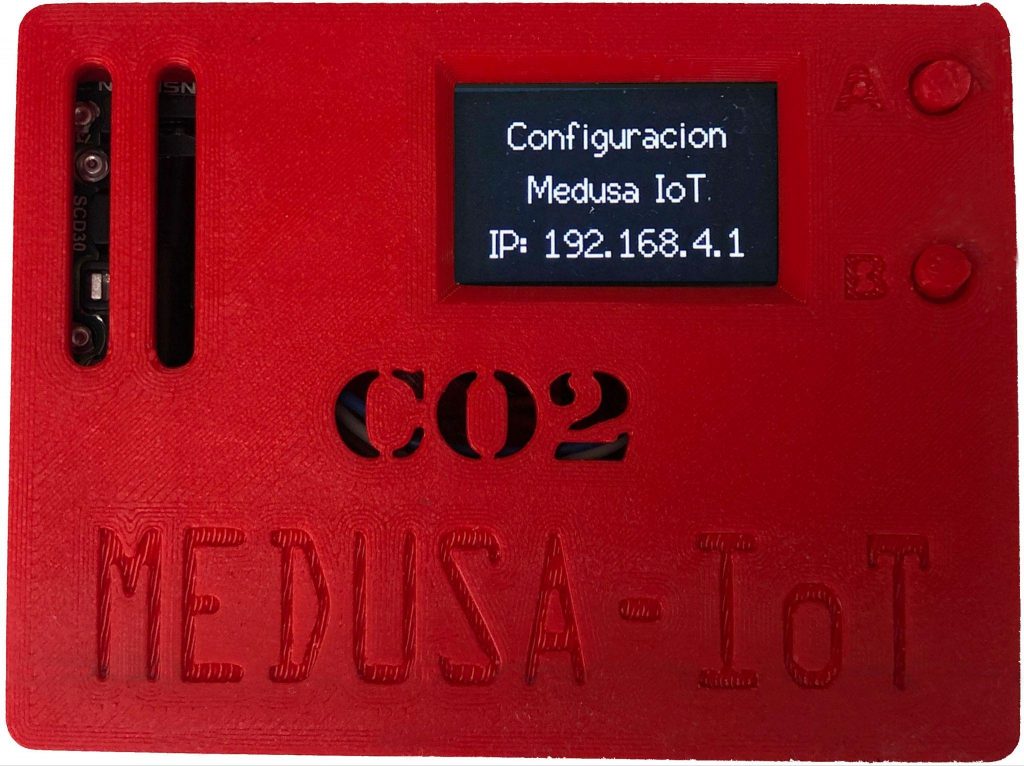
The meter powers on and after a 30-second sensor warm-up shows CO2, temperature, humidity, battery, alarm and wifi status on screen. The reading shifts from green to yellow at 700 PPM and to red with an audible alarm at 900 PPM (configurable thresholds).
It has three buttons: A and B on the front, R (reset) on top. The alarm is disabled by holding B for over 10 seconds.
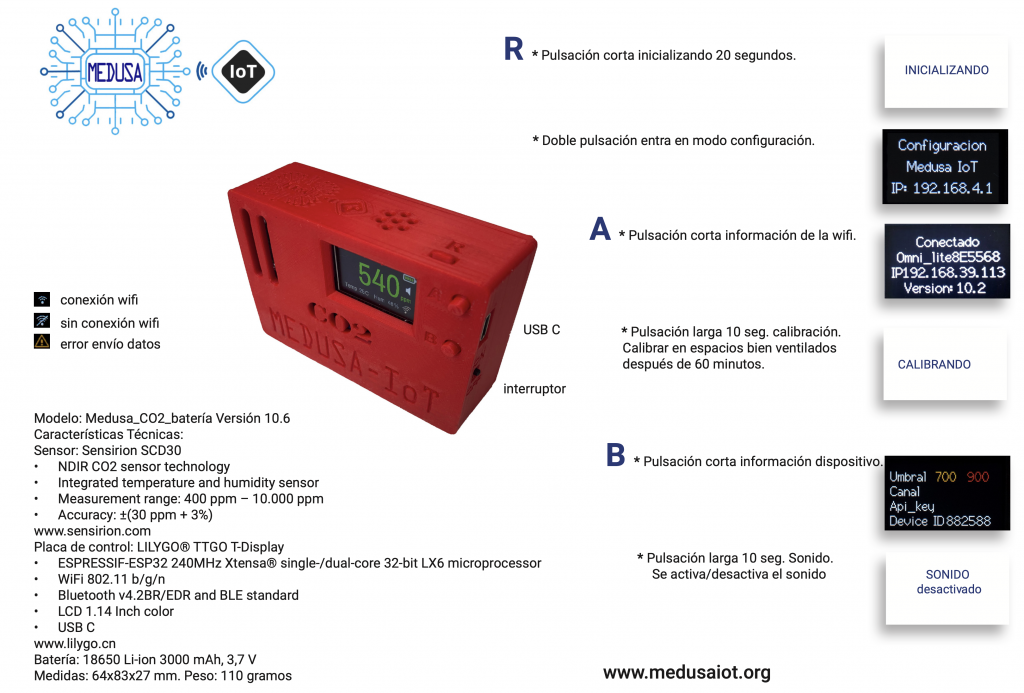
Calibration must be done in a clean environment (410 PPM reference). The sensor includes automatic self-calibration (ASC) over roughly 7 days without unplugging, with periodic exposure to clean air.
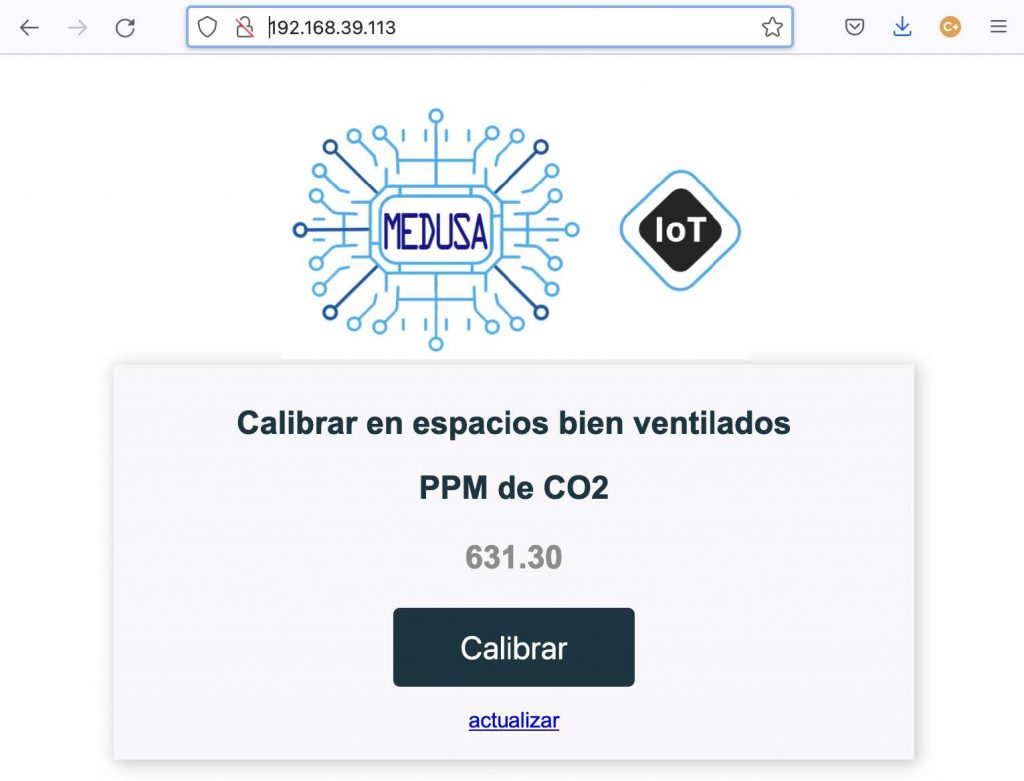
Manual calibration is done by holding A for over 10 seconds, or remotely via the device's IP address (found with a short press of A) on the same network.
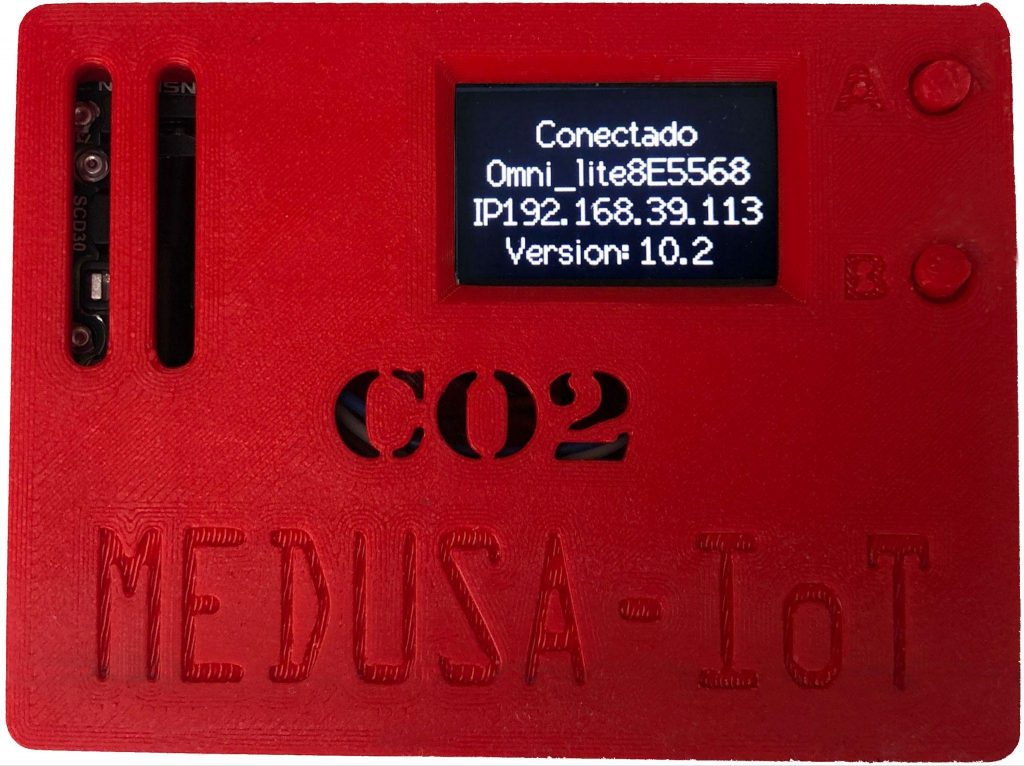
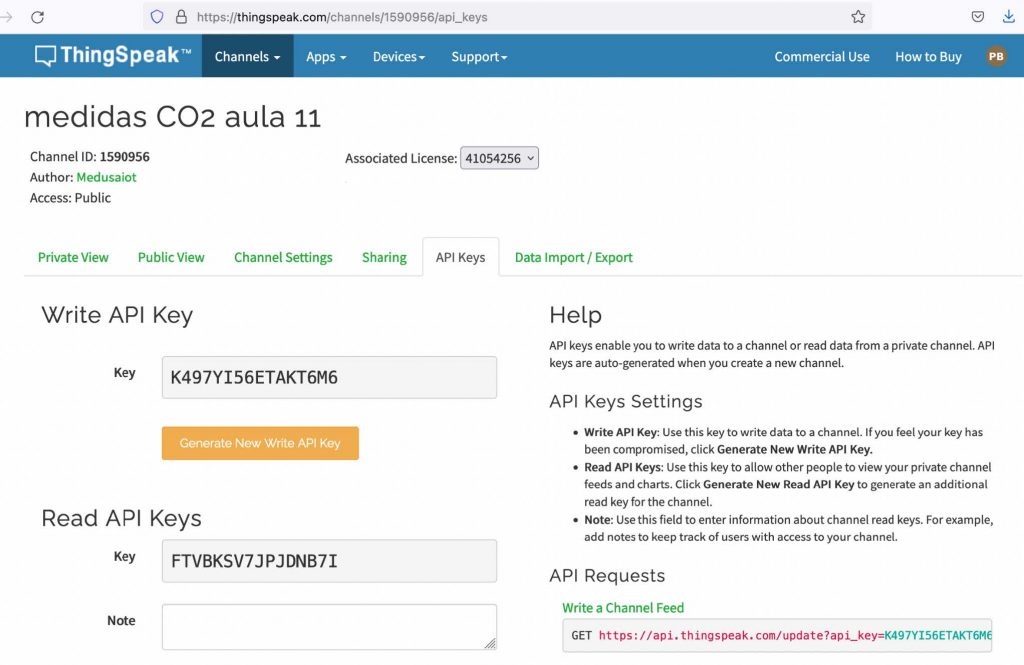
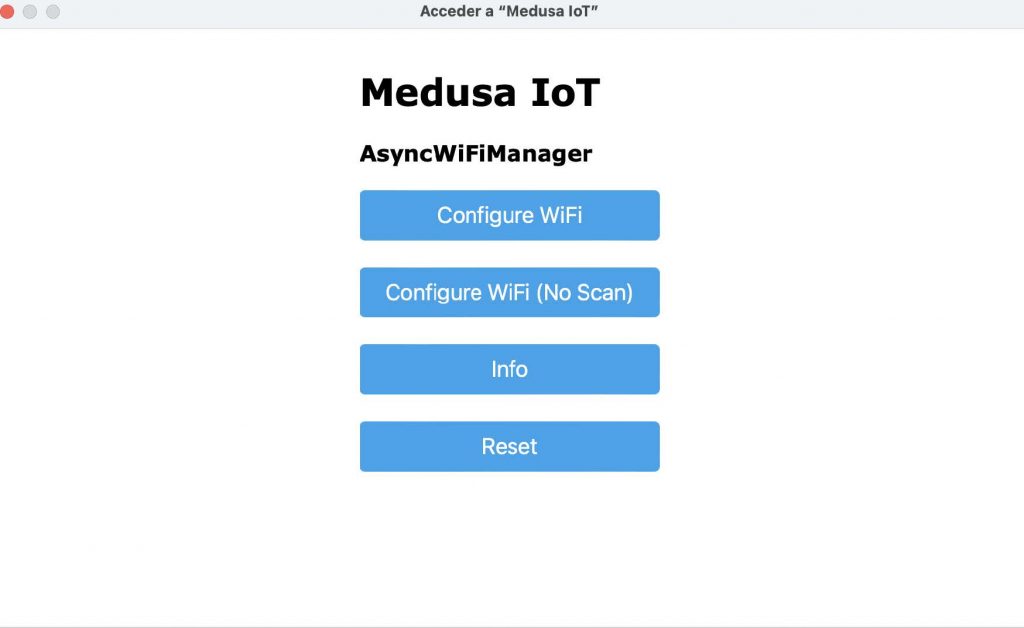
Pressing R twice enters configuration mode, which creates an open «MedusaIoT» wifi network. Connecting opens (or manually browsing to 192.168.0.4) a panel to select the target wifi network, set alarm thresholds, and enter the ThingSpeak channel credentials (Write API Key and Channel ID).
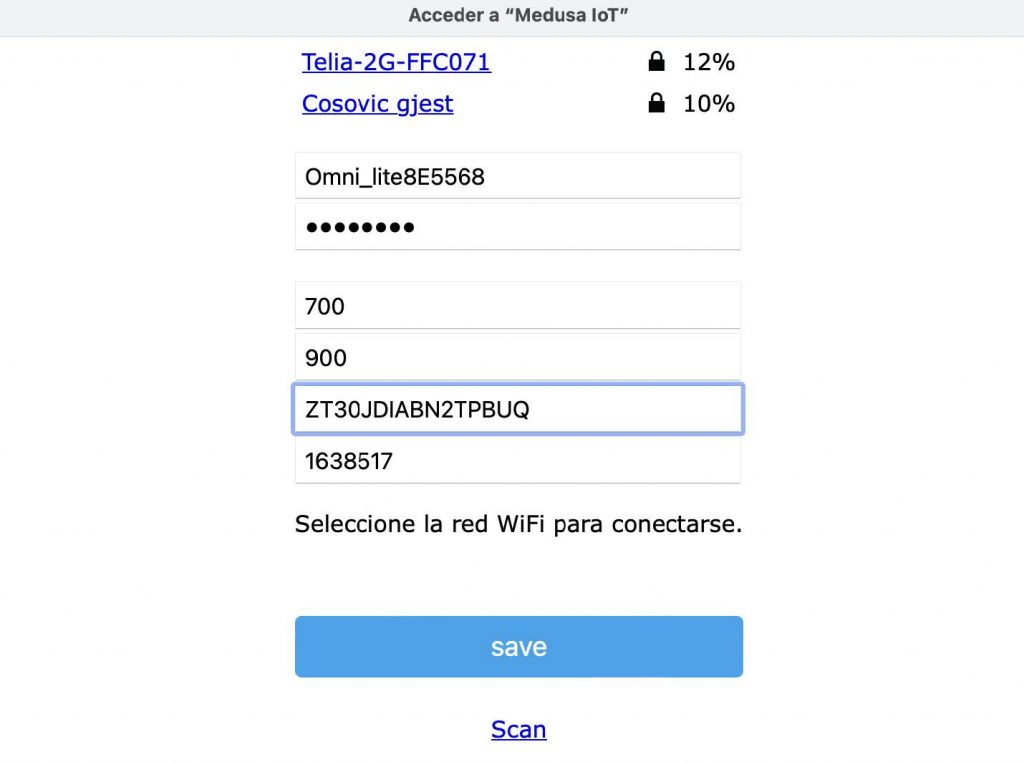
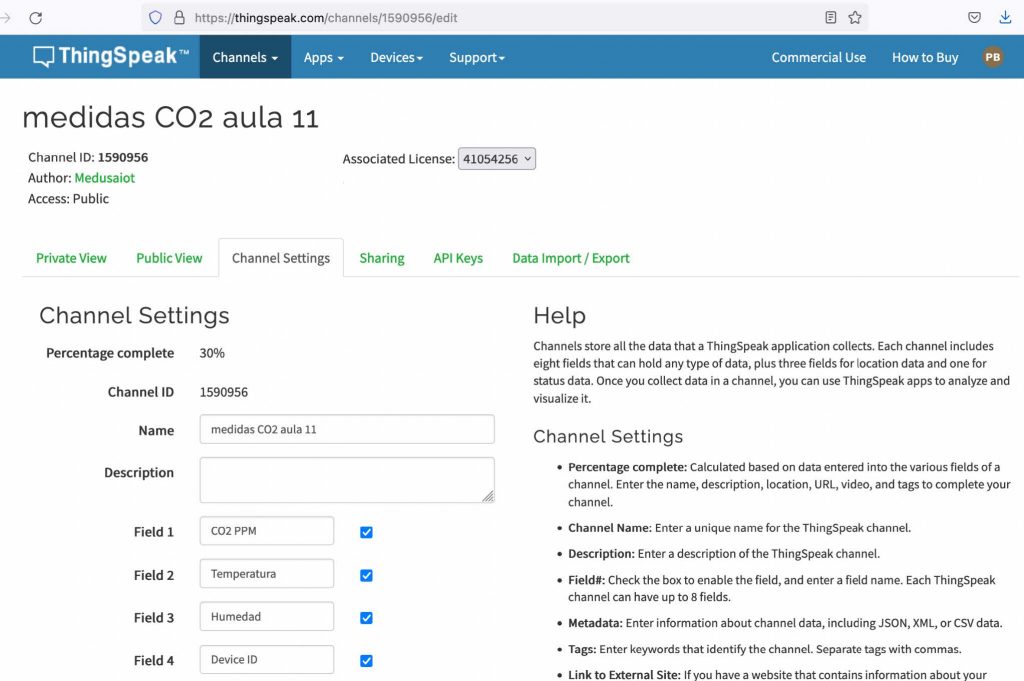
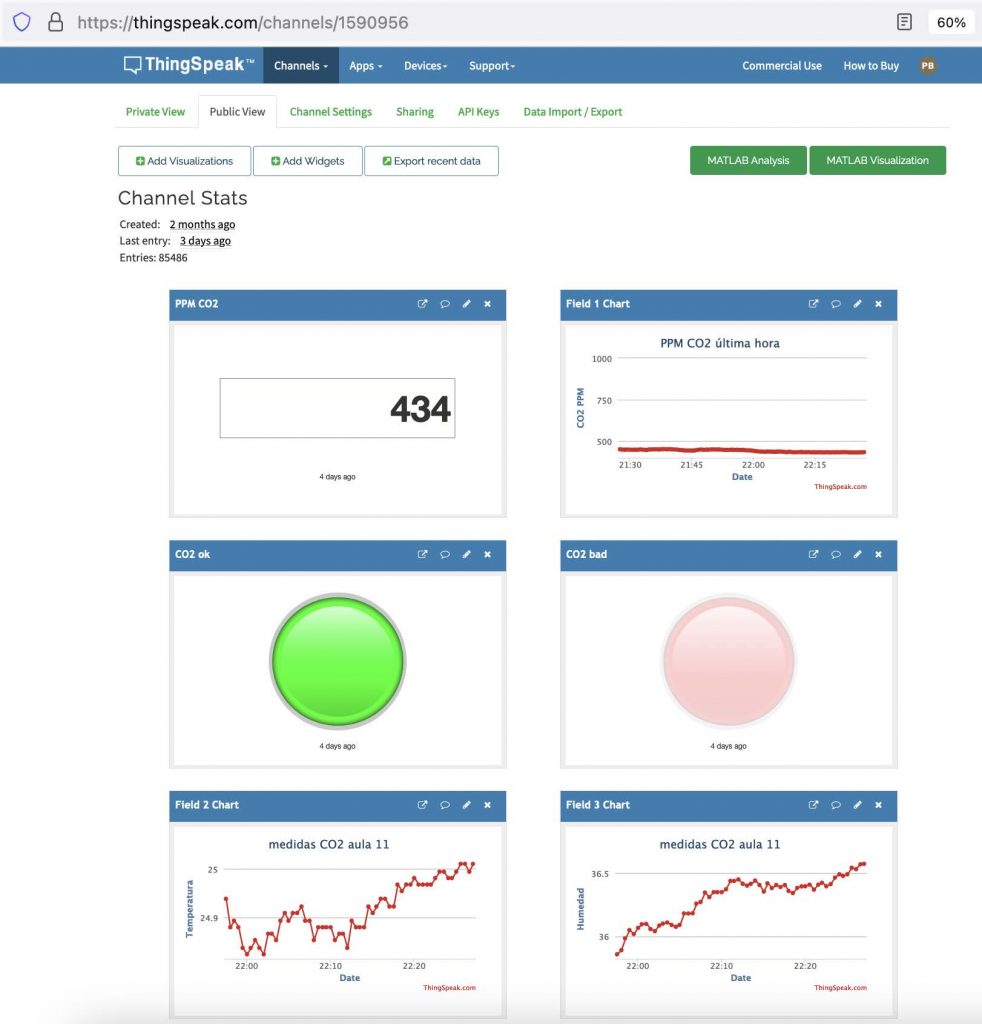
Data is sent to ThingSpeak (free tier), which assigns a channel and write key per sensor. Automatic email alerts were configured for when a channel exceeds a set CO2 value.
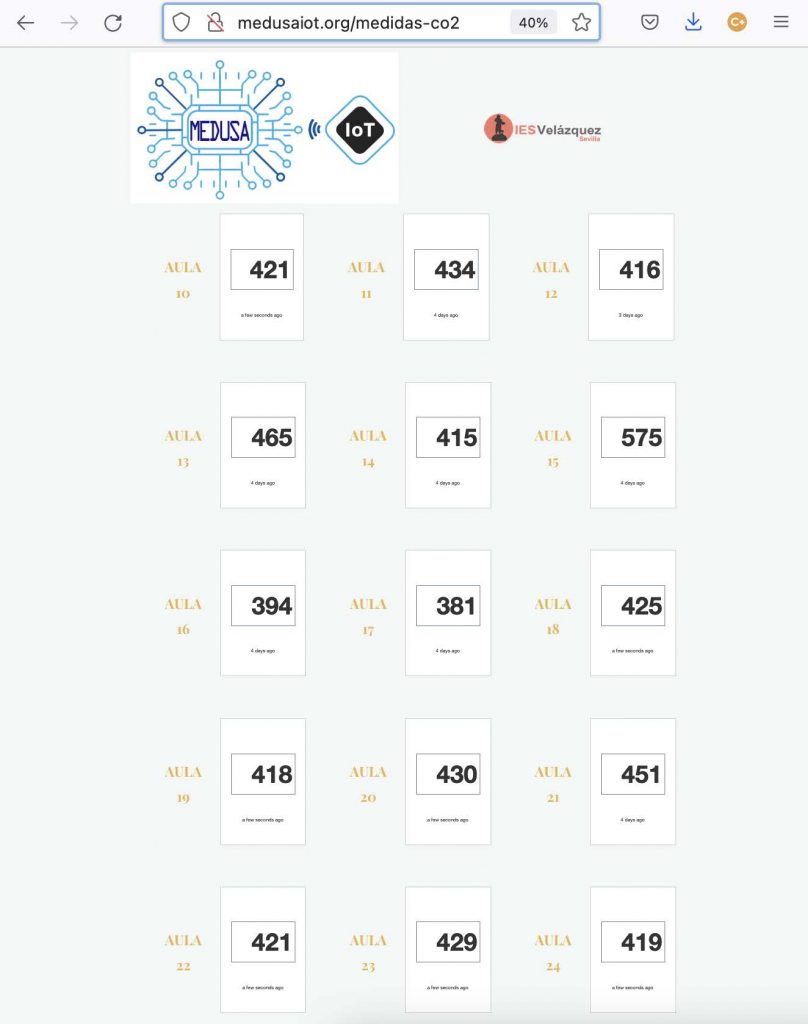
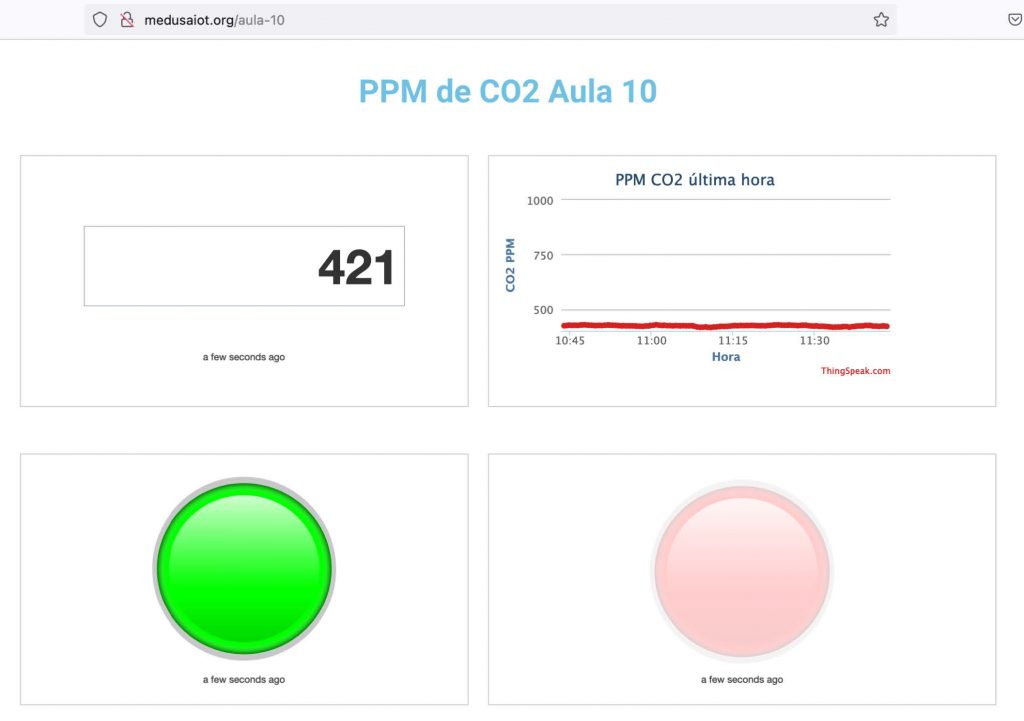
To visualize all 40 classrooms, a custom dashboard was built (medusaiot.org/medidas-co2) showing each classroom's status and, on selection, its CO2 trend over the last hour.
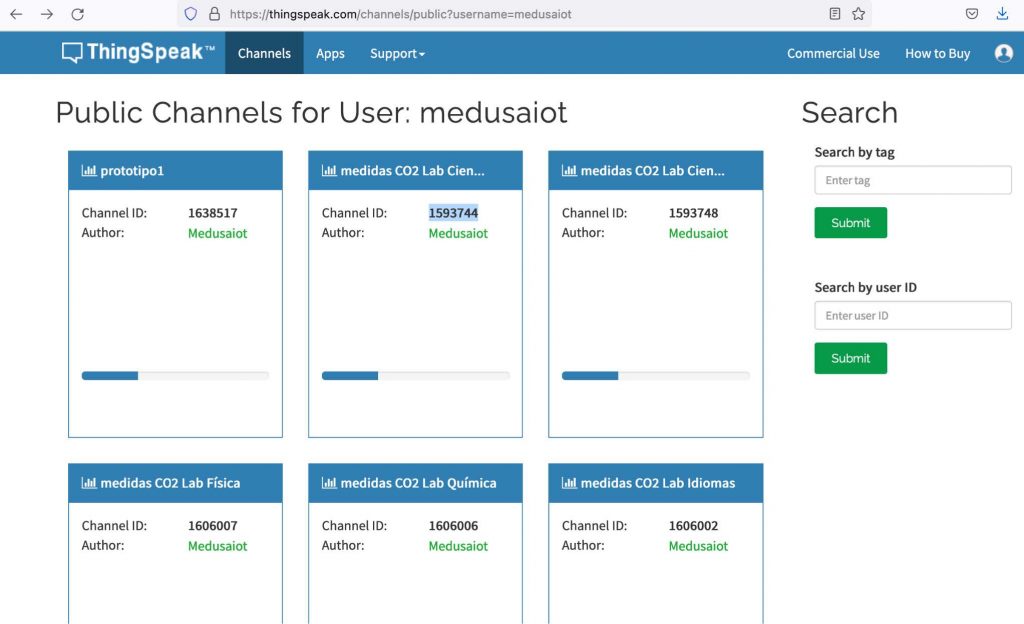
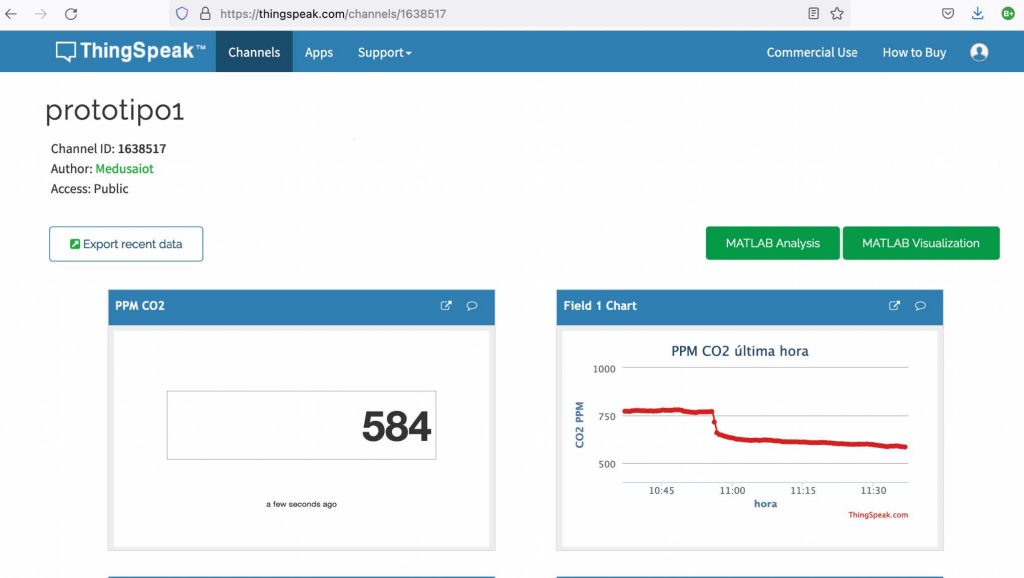
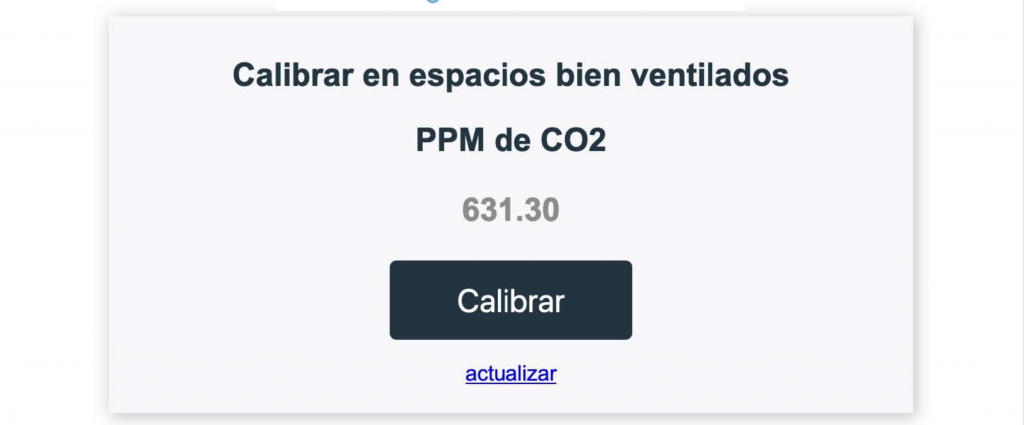
Periodic calibration (outside school hours, ventilated rooms) was automated with a Python script: it uses requests against the ThingSpeak API to read each sensor's PPM by IP, and Selenium to press the calibration button on each device's web page if below 410 PPM.
It generates a log and emails it. Packaged with PyInstaller as an executable so the machine running the scheduled task doesn't need Python installed.
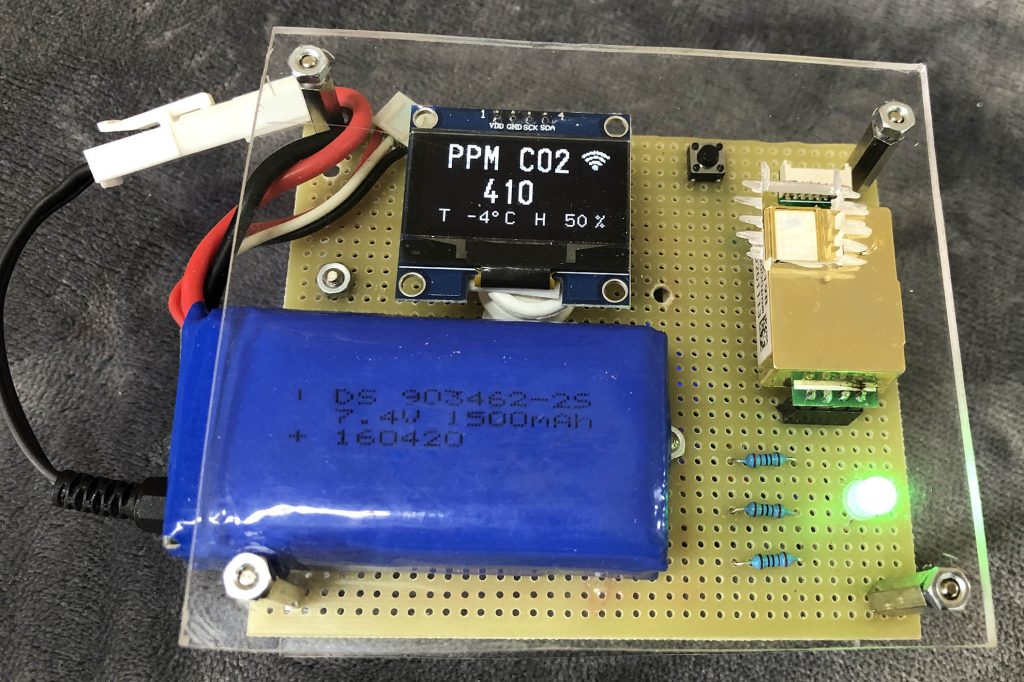
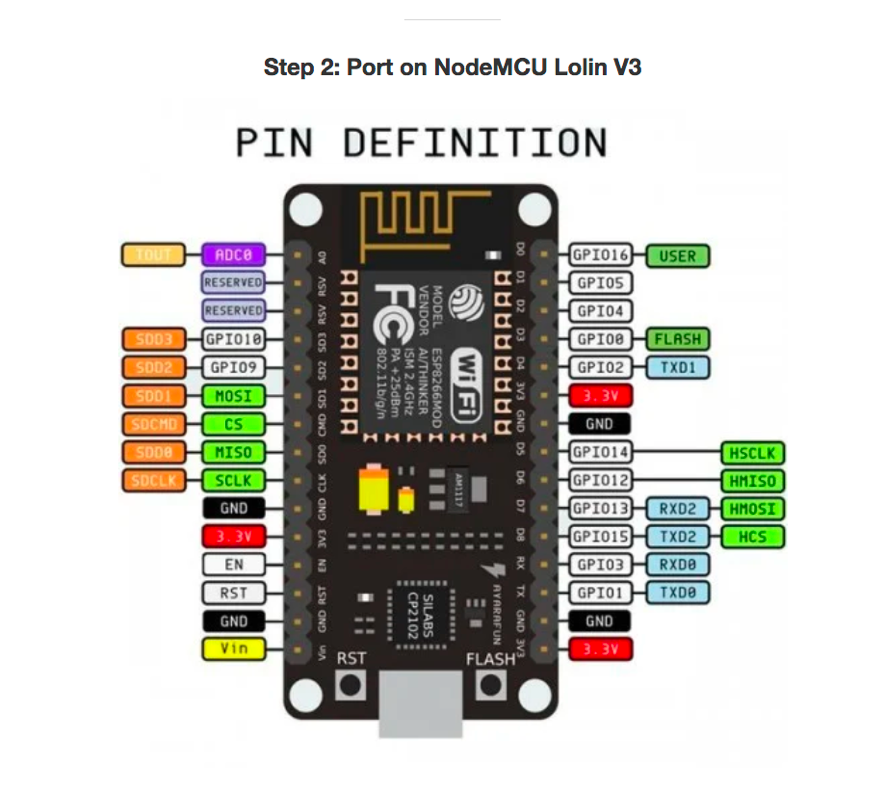
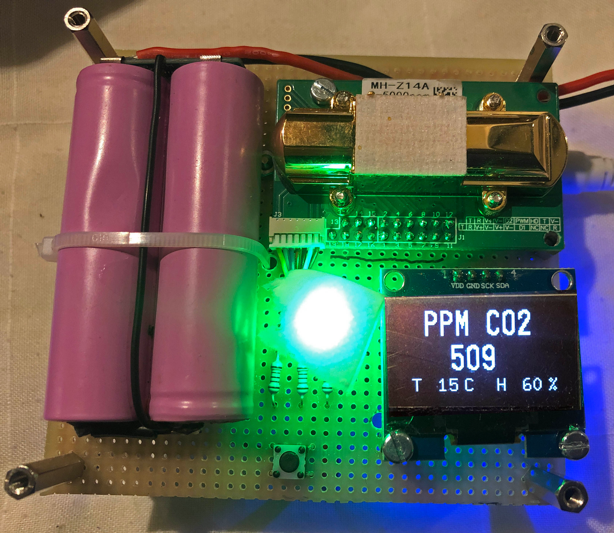
ESP8266/ESP32-based analyzer with the MH-Z14A sensor. Materials: NodeMCU Lolin V3, MH-Z14A sensor, 1.3" 128×64 OLED display, RGB LED, 4× 220Ω resistors, calibration pushbutton.
Firmware (Arduino) is available for download, along with the same wiring applicable to the MH-Z19B sensor.
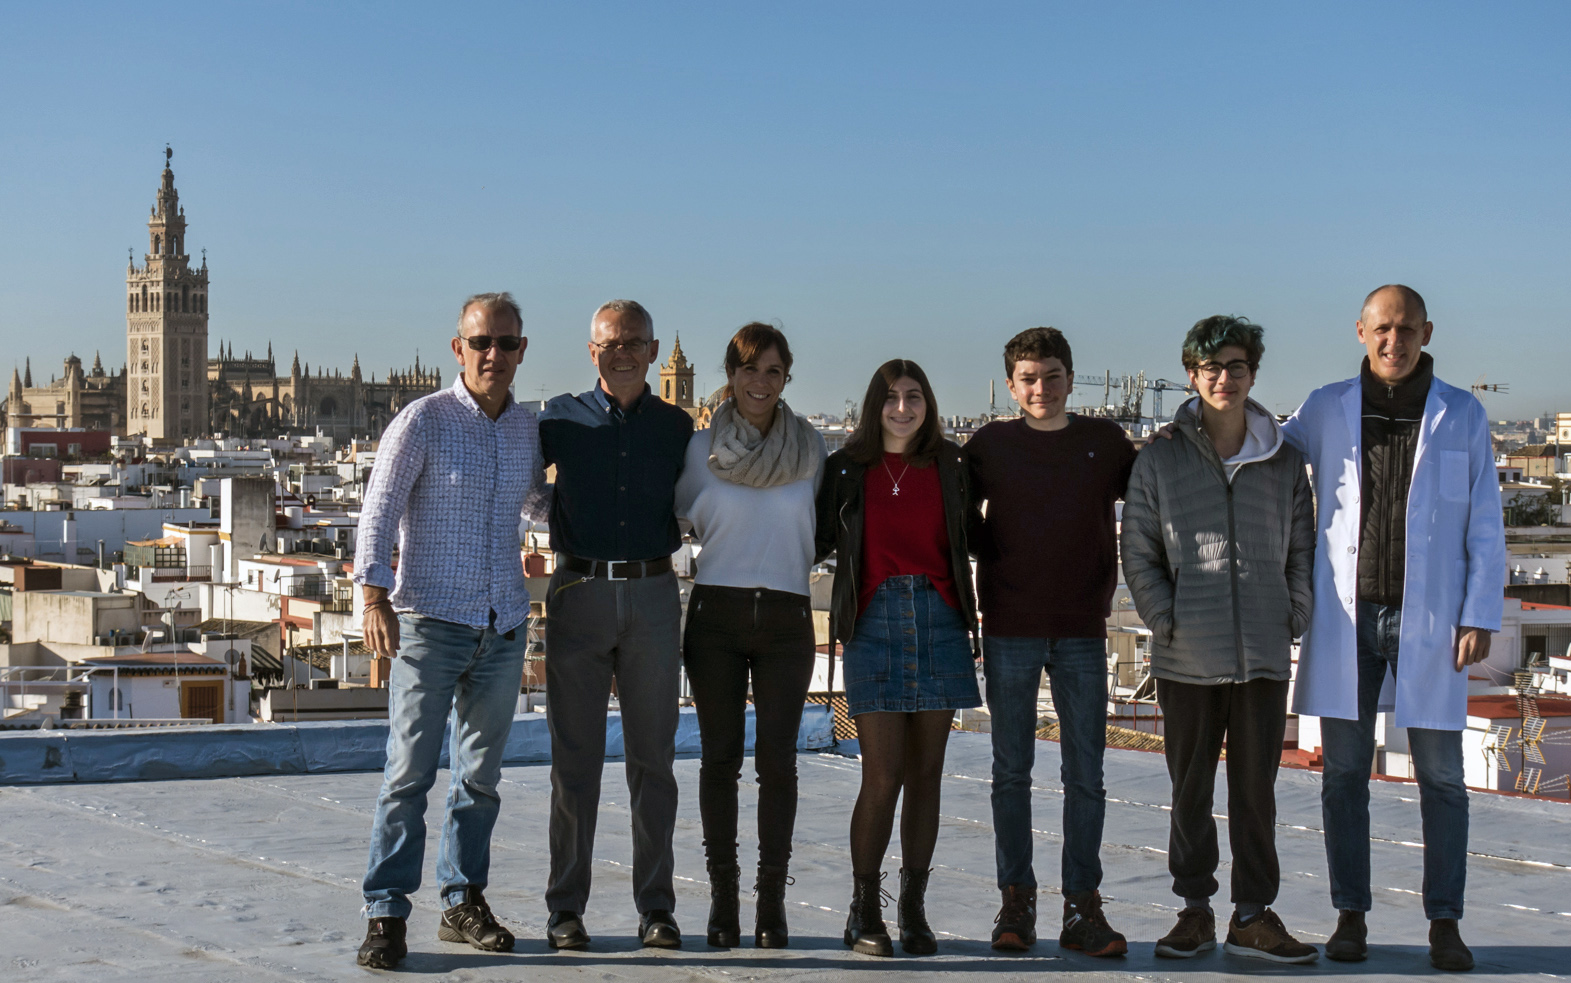
This project would not have been possible without the involvement of Antonio Barrios, Mercedes García de Casasola, Adolfo Martínez, Manuela Gordillo and Fernando Carrillo, as well as the students at the school who actively took part in its development and deployment, and the school's Parents' Association (AMPA).
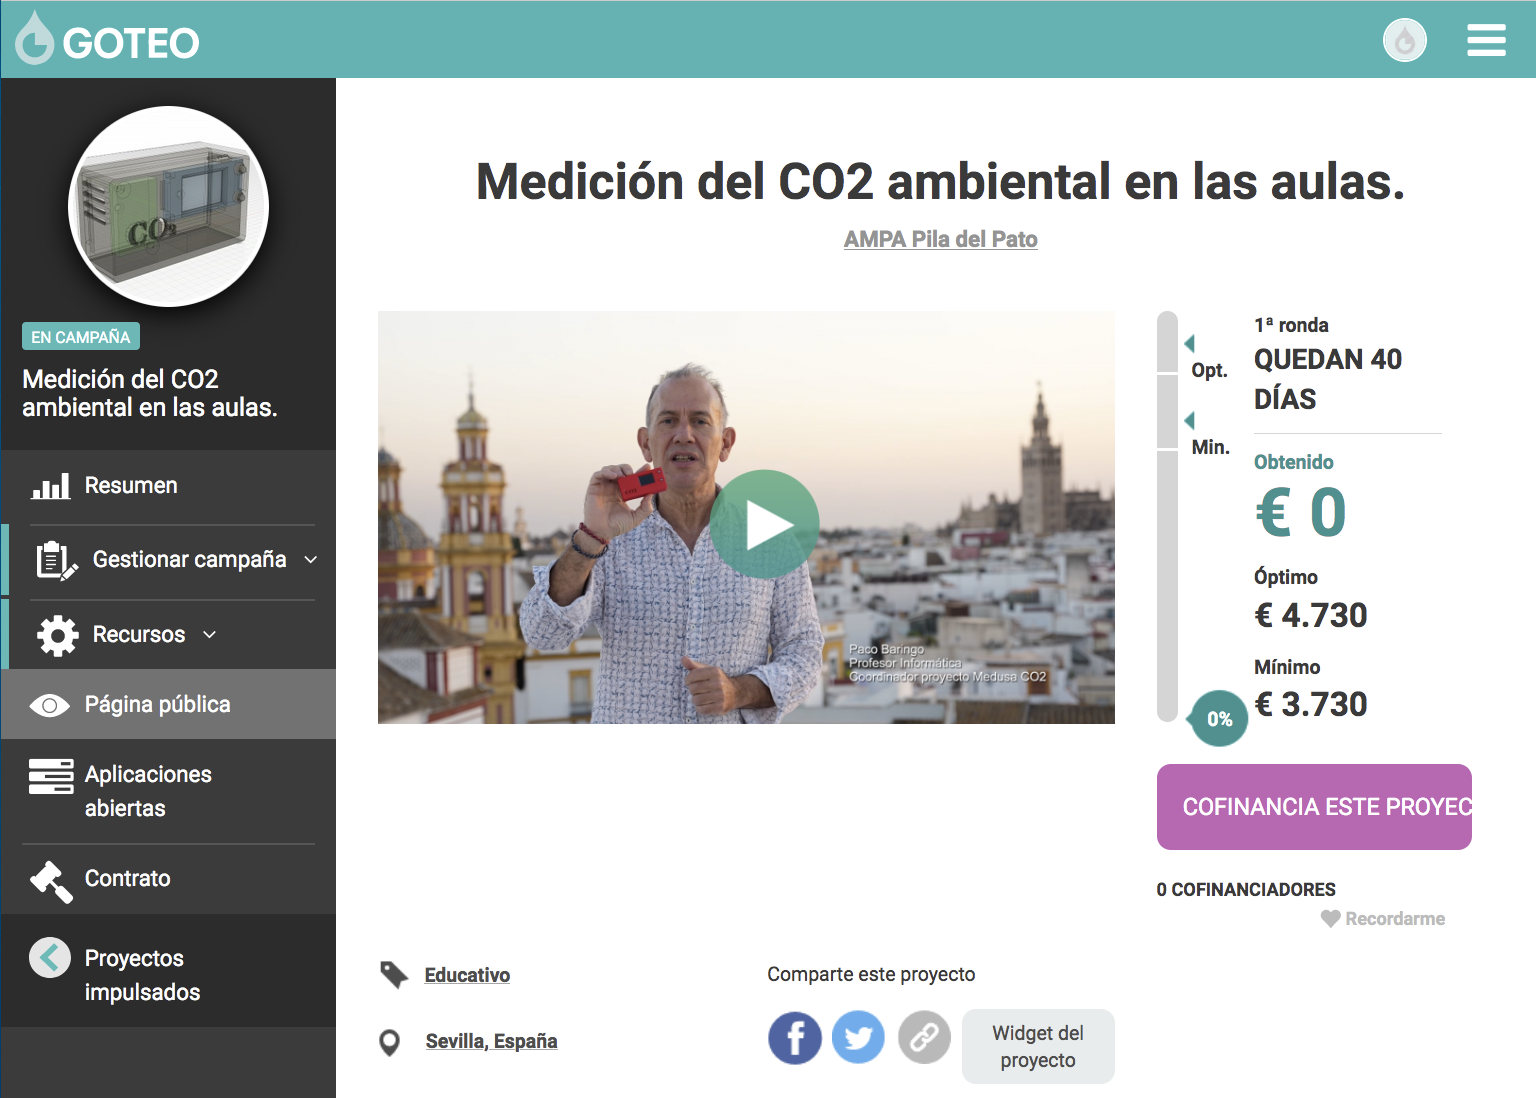
The project was also supported by a crowdfunding campaign on Goteo, driven by the school's Parents' Association (AMPA).